
What is D3?

Frontend developers are fortunate to have access to 3rd party charting tools like Google Charts that make building basic charts a breeze. These tools are great for quickly putting together conventional charts that fit a predefined structure.
But sometimes you need more flexibility in your charts than these libraries allow. That's where D3 comes in. D3 is a not strictly a charting library, but rather a library for creating and manipulating Scalable Vector Graphics (SVGs). And it's compliant with current web standards so no plugins are required for modern browsers. D3 offers data-binding, interactivity, and animated transitions.
Below are images from three of the examples at d3js.org. As nice as they look, these are just static snapshots that don't showcase the interactivity or animation that's possible with D3.
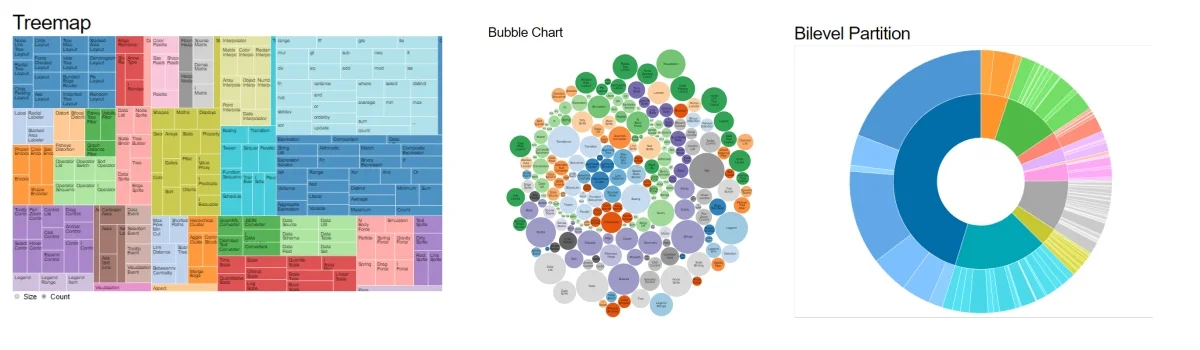
There are tradeoffs for the features and flexibility that D3 provides, mainly that the developer is responsible everything that's included in the visualization: scales, axes, legends, lines, colors, etc. And the learning curve is a little steep. The code is just JavaScript, and D3 selectors resemble jQuery selectors, but the D3 coding patterns can take some time getting used to.
There are a several repositories of D3 example on the Web. Check them out and you'll see that traditional charts are just the tip of the iceberg of D3s capabilities:
You can uses these examples as inspiration or as a starting point for a visualization that you're trying to build yourself.